Workforce Development Matters
Why Workforce Development Matters
Workforce and economic development data deliver insight on trends and shifts in the workforce, on a national, state, county, and city level. OWINN is dedicated to making data-driven decisions. The following section highlights recent workforce and economic data that frame the reason why workforce development and OWINN’s continued work in the State truly impacts the Nevada workforce.

Labor Force Participation Rate
The labor force participation rate is calculated by adding the total number of people who are employed (actively working) and unemployed (not working, but able to work and are actively seeking work) divided by the total population. This data demonstrates that Nevada’s workforce is above the national average for labor force engagement.
View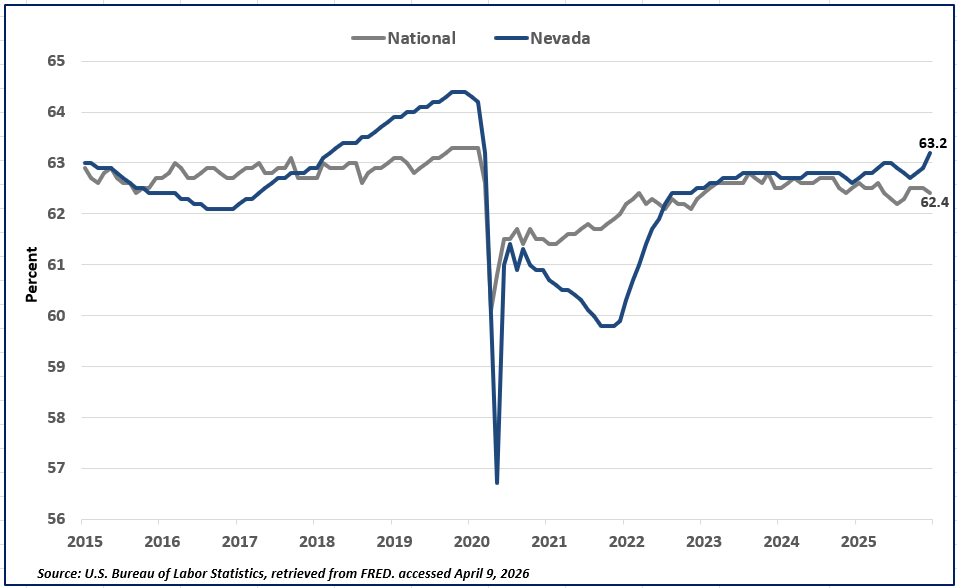
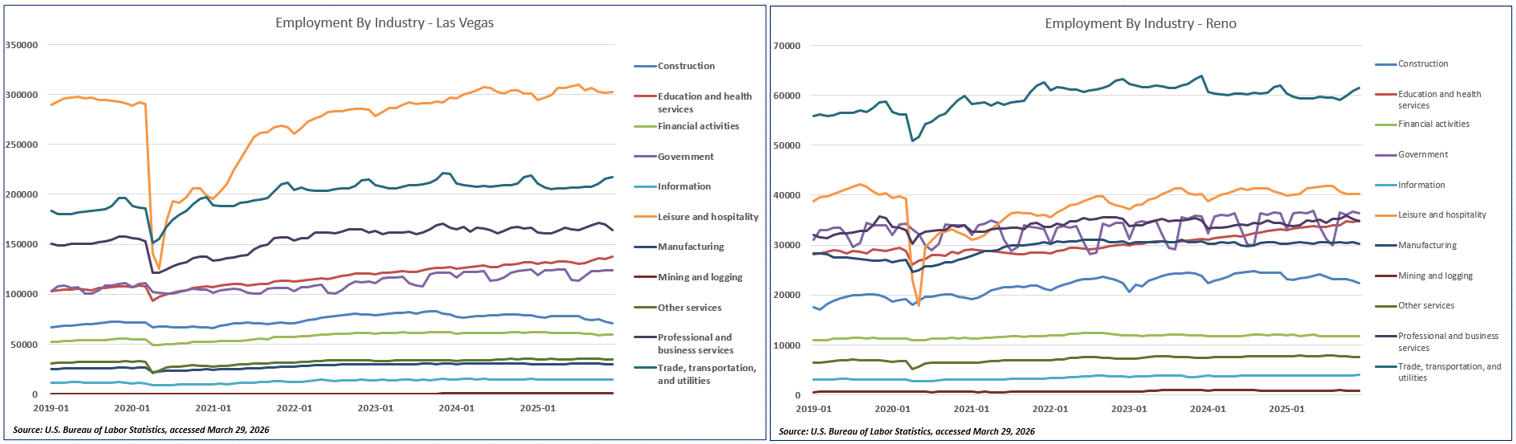
Employment By Industry
Industry employment vastly ranges between Nevada’s two metropolitan areas. Leisure and hospitality is the main industry in Las Vegas, comprising 26 percent of total employment in January 2026. Trade, transportation, and utilities is the main industry in Reno-Sparks, accounting for 22 percent of total employment in January 2026. Government employment in both regions has remained stable over the past five years. Trade, Transportation and Utilities, Professional and Business Services, and Education, and Health Services fared well in Las Vegas and Reno post pandemic. The industries that experienced the most growth from January 2021 to January 2026 were Arts, entertainment, and recreation in Las Vegas (grew 89 percent) and Information in Reno (grew 40 percent).
View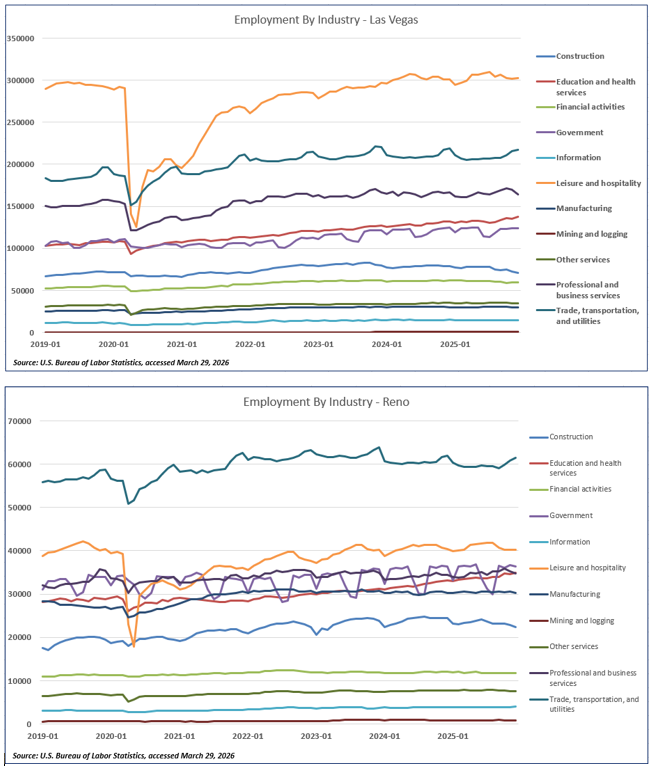
Current & Projected Employment
The charts illustrate how COVID-19 impacted employment in Nevada’s largest cities and the projected employment growth over the next five years. From 2020 to 2025, jobs increased by 24.9% in Las Vegas-Henderson-North Las Vegas, NV, outpacing the national growth rate, and expected to surpass 1.35 million jobs by 2030. Similarly, Reno-Sparks MSA saw jobs increased by 13% during this period again outpacing the national growth rate, and expected to exceed by 322,000 by 2030.
View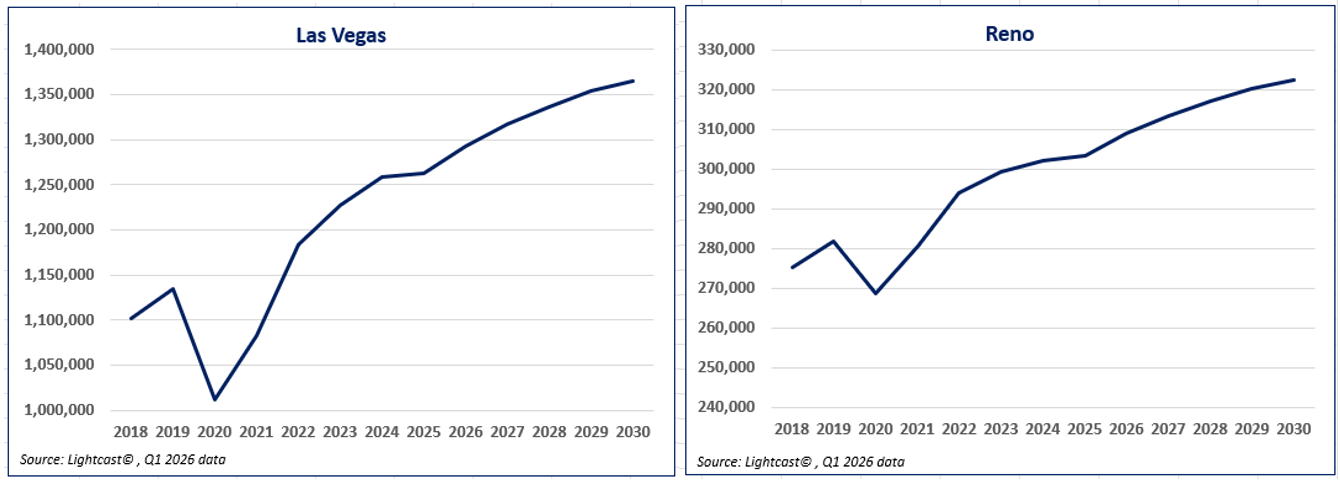
Top Growing Occupations
Nevada’s workforce supply is constantly evolving. Las Vegas and Reno both show strong job growth through 2025, led by management, business, and healthcare roles. Las Vegas sees especially large gains in transportation and community services, while Reno shows faster percentage growth in technical and financial occupations. Both regions highlight rising demand for skilled, higher‑wage professions.
View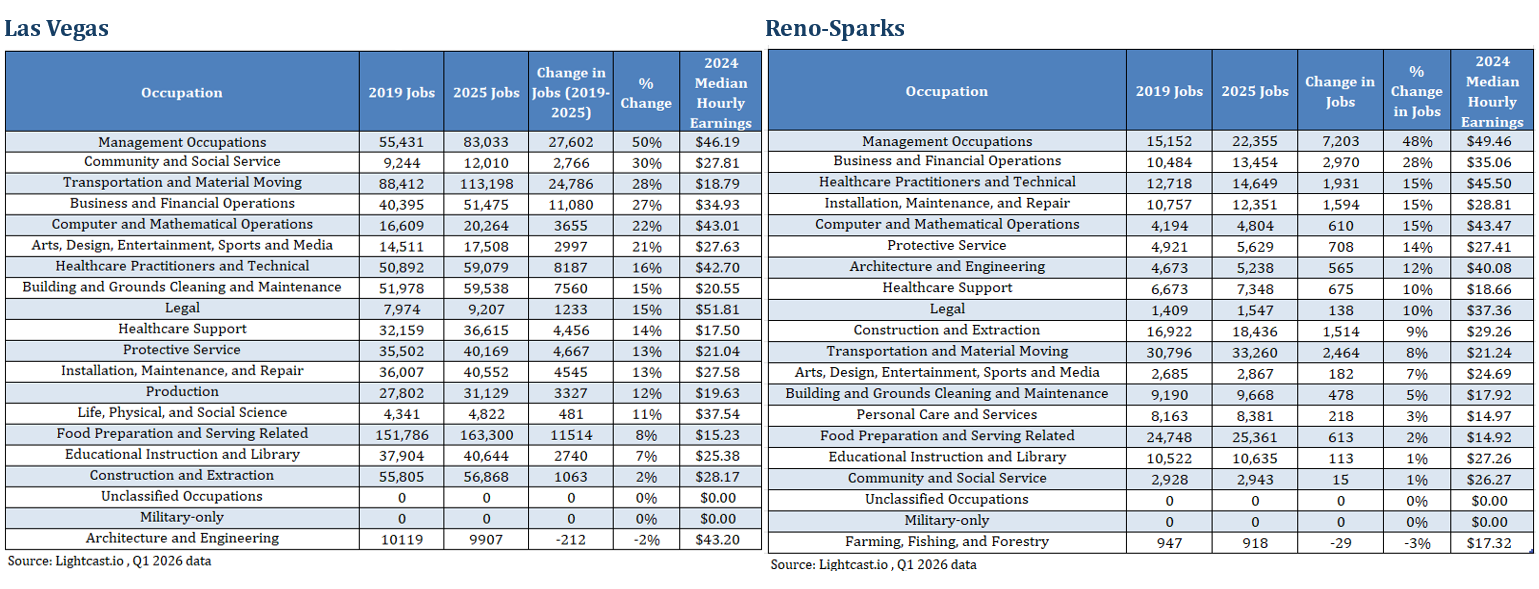
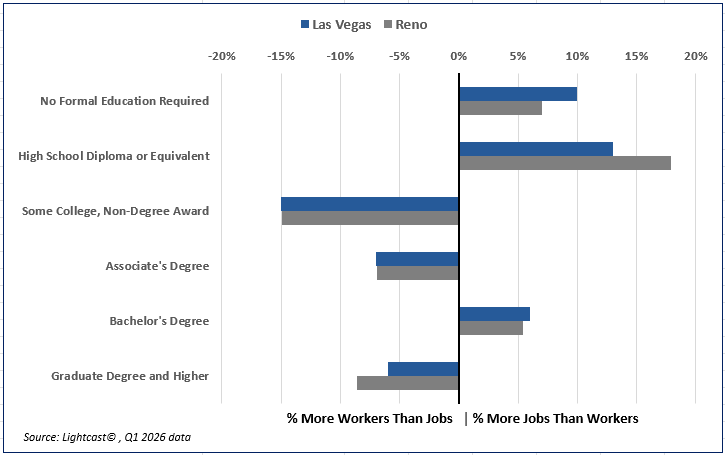
Skills Mismatch
Skills mismatch refers to the difference level of education that a person has versus the level of education required for a particular job. In the chart, bars on the right of the axis indicate that there are more jobs that require either no formal education, a high school diploma or equivalent, or bachelor’s degree than the number of workers who have those credentials.
View